← Back to Blog

How to Calculate ROAS: Formula, Break-even and Calculator

Calculate ROAS
Christian Beeking
Christian Beeking
Co-Founder, Cloudginny
September 18, 2026 6 min read

ROAS (return on advertising spend) tells you how much revenue every advertising dollar brings back, and calculating it takes ten seconds. The real work is the judgement call: whether the number is any good, whether you actually earn on it and why a high ROAS can still mean a loss.

How do you calculate ROAS?

ROAS = revenue from advertising divided by advertising costs. Spend $1,000 on ads and generate $4,000 in revenue and your ROAS is 4.0, or 400% expressed as a percentage. The metric measures revenue per advertising dollar, not profit.

There is nothing more to the formula, and that is exactly why the real work only starts once you have the number: at the question of where you actually begin to earn money.

What is break-even ROAS?

Break-even ROAS is the point at which your advertising pays for itself, and it is quick to work out: 1 divided by your margin. At a 30% margin break-even sits at 3.33, at a 20% margin it is already 5.0. Everything above your break-even is profit from the channel, everything below it is growth you are paying for without a return.

The calculation gets sharper if you use your contribution margin rather than your plain gross margin, meaning what really remains after cost of goods, shipping and payment fees, which pushes the threshold slightly higher. For how a full advertising budget follows from this, see our guide to Google Ads costs.

ROAS calculator for online shops

Most ROAS calculators divide two numbers and stop there. This one knows your margin, which is why it answers the question that counts: what is left at the end, in dollars.

ROAS calculator

What is left at your ROAS?

Pick your margin and your ROAS. The calculator walks through, line by line, what becomes of $1,000 in ad spend and what actually stays with you.

Your margin
Your ROAS
Your ad spend, as the basis$1,000
Revenue from ads: $1,000 times ROAS 2.0$2,000
Of that, contribution margin: $2,000 times 20%$400
Revenue from ads: $1,000 times ROAS 3.0$3,000
Of that, contribution margin: $3,000 times 20%$600
Revenue from ads: $1,000 times ROAS 4.0$4,000
Of that, contribution margin: $4,000 times 20%$800
Revenue from ads: $1,000 times ROAS 5.0$5,000
Of that, contribution margin: $5,000 times 20%$1,000
Revenue from ads: $1,000 times ROAS 6.0$6,000
Of that, contribution margin: $6,000 times 20%$1,200
Revenue from ads: $1,000 times ROAS 2.0$2,000
Of that, contribution margin: $2,000 times 25%$500
Revenue from ads: $1,000 times ROAS 3.0$3,000
Of that, contribution margin: $3,000 times 25%$750
Revenue from ads: $1,000 times ROAS 4.0$4,000
Of that, contribution margin: $4,000 times 25%$1,000
Revenue from ads: $1,000 times ROAS 5.0$5,000
Of that, contribution margin: $5,000 times 25%$1,250
Revenue from ads: $1,000 times ROAS 6.0$6,000
Of that, contribution margin: $6,000 times 25%$1,500
Revenue from ads: $1,000 times ROAS 2.0$2,000
Of that, contribution margin: $2,000 times 30%$600
Revenue from ads: $1,000 times ROAS 3.0$3,000
Of that, contribution margin: $3,000 times 30%$900
Revenue from ads: $1,000 times ROAS 4.0$4,000
Of that, contribution margin: $4,000 times 30%$1,200
Revenue from ads: $1,000 times ROAS 5.0$5,000
Of that, contribution margin: $5,000 times 30%$1,500
Revenue from ads: $1,000 times ROAS 6.0$6,000
Of that, contribution margin: $6,000 times 30%$1,800
Revenue from ads: $1,000 times ROAS 2.0$2,000
Of that, contribution margin: $2,000 times 35%$700
Revenue from ads: $1,000 times ROAS 3.0$3,000
Of that, contribution margin: $3,000 times 35%$1,050
Revenue from ads: $1,000 times ROAS 4.0$4,000
Of that, contribution margin: $4,000 times 35%$1,400
Revenue from ads: $1,000 times ROAS 5.0$5,000
Of that, contribution margin: $5,000 times 35%$1,750
Revenue from ads: $1,000 times ROAS 6.0$6,000
Of that, contribution margin: $6,000 times 35%$2,100
Revenue from ads: $1,000 times ROAS 2.0$2,000
Of that, contribution margin: $2,000 times 40%$800
Revenue from ads: $1,000 times ROAS 3.0$3,000
Of that, contribution margin: $3,000 times 40%$1,200
Revenue from ads: $1,000 times ROAS 4.0$4,000
Of that, contribution margin: $4,000 times 40%$1,600
Revenue from ads: $1,000 times ROAS 5.0$5,000
Of that, contribution margin: $5,000 times 40%$2,000
Revenue from ads: $1,000 times ROAS 6.0$6,000
Of that, contribution margin: $6,000 times 40%$2,400
Revenue from ads: $1,000 times ROAS 2.0$2,000
Of that, contribution margin: $2,000 times 50%$1,000
Revenue from ads: $1,000 times ROAS 3.0$3,000
Of that, contribution margin: $3,000 times 50%$1,500
Revenue from ads: $1,000 times ROAS 4.0$4,000
Of that, contribution margin: $4,000 times 50%$2,000
Revenue from ads: $1,000 times ROAS 5.0$5,000
Of that, contribution margin: $5,000 times 50%$2,500
Revenue from ads: $1,000 times ROAS 6.0$6,000
Of that, contribution margin: $6,000 times 50%$3,000

Your break-even ROAS: 1 divided by 20%Above this ROAS your advertising pays for itself.5.00
Your break-even ROAS: 1 divided by 25%Above this ROAS your advertising pays for itself.4.00
Your break-even ROAS: 1 divided by 30%Above this ROAS your advertising pays for itself.3.33
Your break-even ROAS: 1 divided by 35%Above this ROAS your advertising pays for itself.2.86
Your break-even ROAS: 1 divided by 40%Above this ROAS your advertising pays for itself.2.50
Your break-even ROAS: 1 divided by 50%Above this ROAS your advertising pays for itself.2.00
What is left at the end−$600Does not pay off

At $5,000 in ad spend that would be $3,000 in losses, the ratio stays the same.

What is left at the end−$400Does not pay off

At $5,000 in ad spend that would be $2,000 in losses, the ratio stays the same.

What is left at the end−$200Does not pay off

At $5,000 in ad spend that would be $1,000 in losses, the ratio stays the same.

What is left at the end$0Exactly break-even

Exactly the break-even line: revenue covers goods and advertising, nothing more. A bigger budget changes none of that.

What is left at the end$200Pays off

At $5,000 in ad spend that would be $1,000 in profit, the ratio stays the same.

What is left at the end−$500Does not pay off

At $5,000 in ad spend that would be $2,500 in losses, the ratio stays the same.

What is left at the end−$250Does not pay off

At $5,000 in ad spend that would be $1,250 in losses, the ratio stays the same.

What is left at the end$0Exactly break-even

Exactly the break-even line: revenue covers goods and advertising, nothing more. A bigger budget changes none of that.

What is left at the end$250Pays off

At $5,000 in ad spend that would be $1,250 in profit, the ratio stays the same.

What is left at the end$500Pays off

At $5,000 in ad spend that would be $2,500 in profit, the ratio stays the same.

What is left at the end−$400Does not pay off

At $5,000 in ad spend that would be $2,000 in losses, the ratio stays the same.

What is left at the end−$100Does not pay off

At $5,000 in ad spend that would be $500 in losses, the ratio stays the same.

What is left at the end$200Pays off

At $5,000 in ad spend that would be $1,000 in profit, the ratio stays the same.

What is left at the end$500Pays off

At $5,000 in ad spend that would be $2,500 in profit, the ratio stays the same.

What is left at the end$800Pays off

At $5,000 in ad spend that would be $4,000 in profit, the ratio stays the same.

What is left at the end−$300Does not pay off

At $5,000 in ad spend that would be $1,500 in losses, the ratio stays the same.

What is left at the end$50Very tight

At $5,000 in ad spend that would be $250 in profit, the ratio stays the same.

What is left at the end$400Pays off

At $5,000 in ad spend that would be $2,000 in profit, the ratio stays the same.

What is left at the end$750Pays off

At $5,000 in ad spend that would be $3,750 in profit, the ratio stays the same.

What is left at the end$1,100Pays off

At $5,000 in ad spend that would be $5,500 in profit, the ratio stays the same.

What is left at the end−$200Does not pay off

At $5,000 in ad spend that would be $1,000 in losses, the ratio stays the same.

What is left at the end$200Pays off

At $5,000 in ad spend that would be $1,000 in profit, the ratio stays the same.

What is left at the end$600Pays off

At $5,000 in ad spend that would be $3,000 in profit, the ratio stays the same.

What is left at the end$1,000Pays off

At $5,000 in ad spend that would be $5,000 in profit, the ratio stays the same.

What is left at the end$1,400Pays off

At $5,000 in ad spend that would be $7,000 in profit, the ratio stays the same.

What is left at the end$0Exactly break-even

Exactly the break-even line: revenue covers goods and advertising, nothing more. A bigger budget changes none of that.

What is left at the end$500Pays off

At $5,000 in ad spend that would be $2,500 in profit, the ratio stays the same.

What is left at the end$1,000Pays off

At $5,000 in ad spend that would be $5,000 in profit, the ratio stays the same.

What is left at the end$1,500Pays off

At $5,000 in ad spend that would be $7,500 in profit, the ratio stays the same.

What is left at the end$2,000Pays off

At $5,000 in ad spend that would be $10,000 in profit, the ratio stays the same.

The result scales linearly with the budget, which is why the calculator uses a round $1,000. Enter your contribution margin, meaning what really remains after cost of goods, shipping and payment fees, not your gross margin. Returns and cancellations are not deducted here.

What is a good ROAS?

A good ROAS is one above your own break-even. For orientation, real numbers instead of tables from the internet: across our client accounts (several dozen e-commerce accounts in the DACH region, more than 1.8 million clicks between them) the median ROAS is 3.8, with the middle half of accounts between 1.7 and 7.8. A ROAS of 4 is therefore a solid value, still a loss-making business at a 20% margin and a very good one at 50%. Above all, the spread shows one thing: comparing yourself to other shops helps you very little, the comparison with your own break-even is what decides.

ROAS, ACOS, ROI and cost of sale: which one when?

Four metrics that survey the same ground and get confused all the time:

MetricFormulaWhat for
ROASRevenue ÷ ad spendThe standard in Google Ads, a pure revenue view
Cost of sale (KUR)Ad spend ÷ revenueThe inverse of ROAS, common in German retail. A cost of sale of 25% equals a ROAS of 4
ROIProfit ÷ costsProfitability after all costs, for comparing channels
ACOSAd spend ÷ ad revenueThe Amazon counterpart to cost of sale

For steering Google Ads campaigns, ROAS is the given, because Google itself works with it. For the question of whether the channel pays off overall, you need to look at profit, which brings us to the most important section of this article.

Why can a high ROAS still be a loss?

ROAS has one blind spot: it treats every dollar of revenue the same. Whether $4,000 in revenue comes from high-margin private label or discounted shelf-warmers is invisible to the metric, and that is exactly where accounts that look good on paper fall apart. Here is the example that shows the difference, two shops with an identical ROAS:

MetricShop A (30% margin)Shop B (20% margin)
Ad spend$1,000$1,000
Revenue$4,000$4,000
ROAS4.04.0
Break-even ROAS3.335.0
Contribution margin$1,200$800
Result$200 profit$200 loss

Same ROAS, opposite outcome.

POAS

The consequence is called POAS (profit on advertising spend): instead of steering on revenue you steer on contribution margin, by giving products with different margins different ROAS targets, through separate campaigns or product groups. Run everything under one shared target and you let your bestsellers subsidise the shelf-warmers. How to do this in Performance Max without giving up control: steering Performance Max with Cloudginny.

How do I set a target ROAS in Google Ads?

In Google Ads the bidding strategy is called Target ROAS, and it is entered as a percentage: a target of 4x means 400%. Google's requirement: search and Shopping campaigns need at least 15 conversions in the past 30 days, and for Shopping campaigns that counts per Merchant Center ID. Below that the algorithm lacks the data and results fluctuate.

For the level of the target, one simple order applies: start roughly at your actual ROAS of the past few weeks, not at the number you wish for, then move the target step by step towards break-even plus a buffer. Enter an unrealistically high target and you do not get a better ROAS, you get less impression share, because Google only bids on the safest auctions.

Since mid-August 2026 the target you enter carries even more weight: Google now steers budget-constrained campaigns to the value you entered as well. The old side effect, where tightly budgeted campaigns ran well above their target because Google only picked up the cheapest conversions, is gone. The target is no longer a rough direction, you get what you ordered, which is why the order has to be right.

Why is my measured ROAS wrong?

Before you steer with ROAS, the number itself has to be right, and there are four classic sources of error:

The most common case is a static order value in conversion tracking: every order is counted with the same value, whether it brings in $30 or $800, which makes the measured ROAS worthless. For how to set up dynamic value tracking, see our JTL setup guide.

Then there is conversion delay: purchases are attributed to the day of the click, sometimes days later, which is why last week's ROAS always looks too low.

The third source is double counting, when Google Ads, Meta and your shop backend each claim the same order for themselves and the sum of channel revenues exceeds your actual revenue.

And fourth, the gross and net mix: pass gross revenue including cancellations and returns to Google and you make yourself richer than you are. Broken value tracking, incidentally, is the first thing Ginny checks on newly connected accounts, because without clean values every ROAS decision is flying blind.

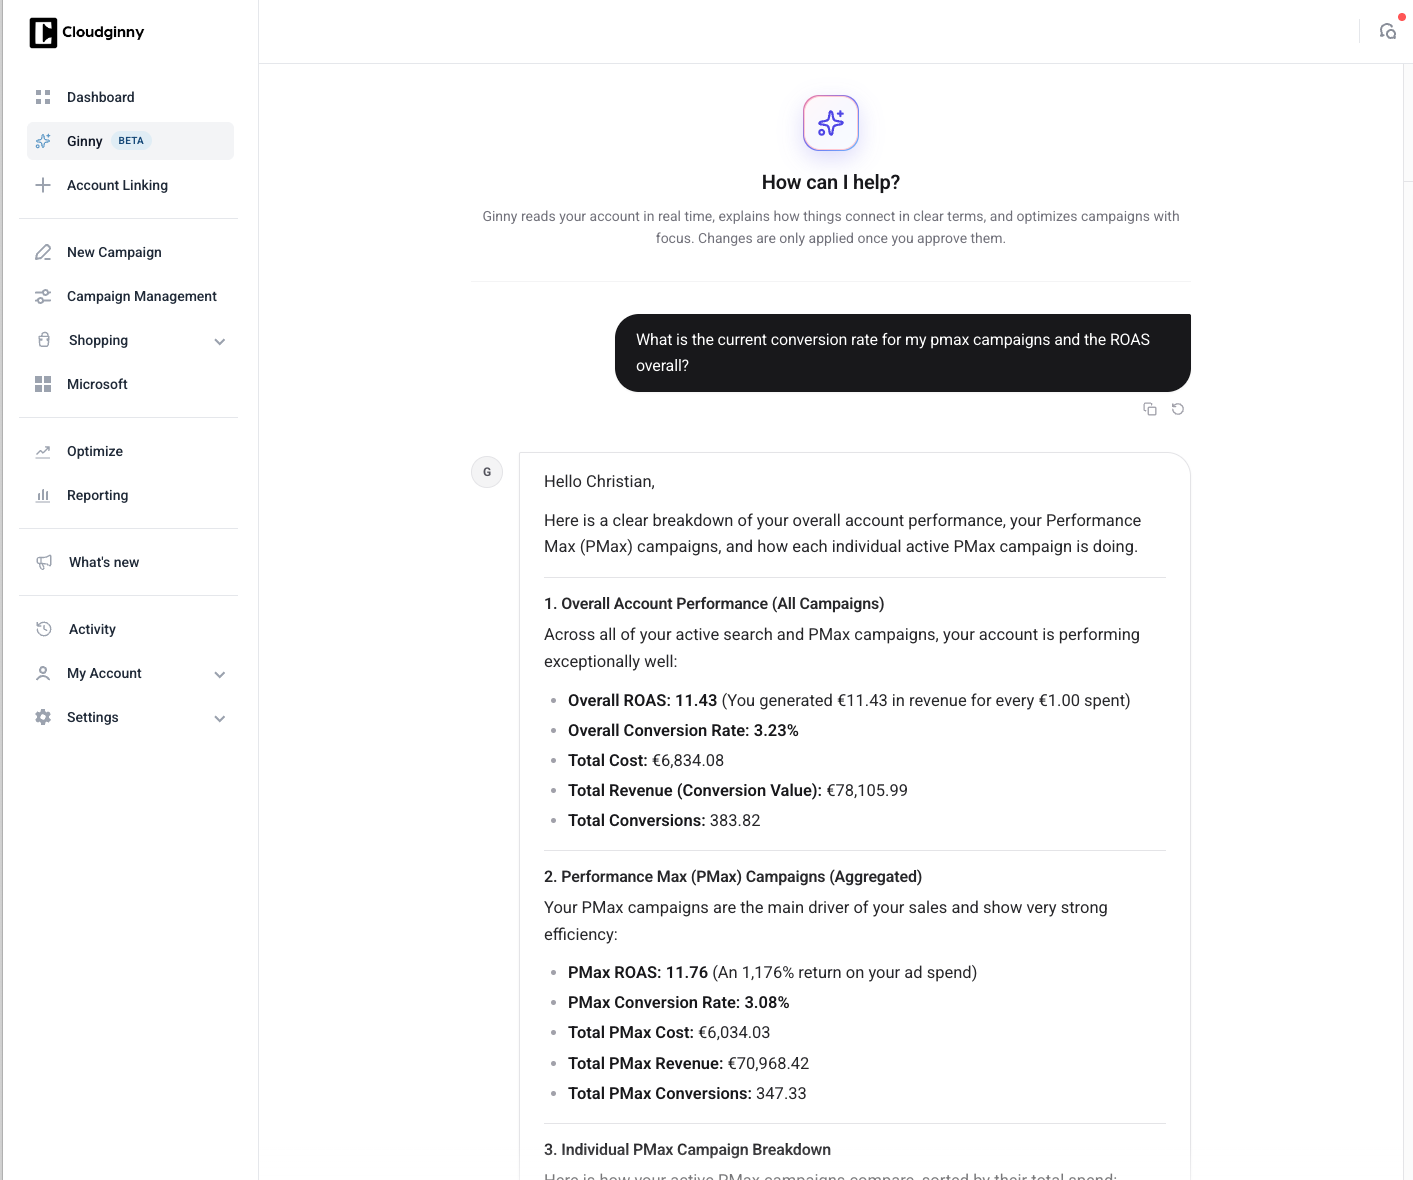
Ginny answering a question about conversion rate and ROAS in the Cloudginny chat, with overall account ROAS, cost and revenue
ROAS, conversion rate, cost and revenue from a single question, broken down by account and by individual campaign.
Christian Beeking
About the author
Christian Beeking LinkedIn

Christian Beeking is co‑founder of Cloudginny, the AI agent for automating Google Ads in e‑commerce. Before Cloudginny, the team managed more than 100 million euros in Google Ads budget for brands such as MediaMarkt, Cisco and Bose, and has now poured that knowledge into Ginny. Cloudginny is an official Google Partner, a WebStollen partner and part of the German Accelerator.

plans

Get Started

plans

Related articles

Our platform is designed to empower businesses of all sizes to work smarter and achieve their goals with confidence.
Cloudginny vs. Mai Breakdown

Cloudginny vs. MAI: Comparison for Online Shops 2026

MAI runs Google and Meta largely autonomously through AI agents, targets growing D2C brands and publishes no prices. Cloudginny is a Google Ads specialist for small and mid-sized shops, with prices published from $149. This comparison puts both side by side and says plainly where MAI is the better fit.

Read full blog
Cloudginny vs. AdScale

Cloudginny vs. AdScale: Comparison for Online Shops 2026

AdScale is a broad e-commerce suite covering Google, Meta, creatives, email and SMS. Cloudginny is the opposite: a Google Ads specialist for shops selling into German-speaking markets. This comparison puts prices, channels, shop system support and control models side by side, and says plainly where AdScale is the better choice.

Read full blog

Google Merchant Center: The Practical Guide for Online Shops

No Merchant Center, no Google Shopping, and yet most merchants only get to know the account once products start getting disapproved. This guide covers both: how the data hub between your shop and Google works, and what to do when it jams. With numbers from our own customer accounts on how often Google really disapproves, how many approved products never get served, and what an account suspension costs in revenue.

Read full blog